
Every country reorganises its local government sooner or later. The units are too small, too expensive, or too poorly matched to the services they're meant to provide. So governments propose merging them into larger, more viable authorities. And almost everywhere, the reform stalls on the same questions: merge which units, with whom, and what would each new authority actually look like financially?
We built the tool that answers them: a scenario builder where anyone can test a merger in seconds and watch the finances of the new unit recompute as they click. It has been fully built for two very different systems so far, and the mechanics carry across borders.
The challenge
A consolidation reform lives or dies on specifics. A ministry can't legislate "merge the small units"; it has to propose actual groupings, and each grouping has to survive scrutiny: Is the merged authority financially viable? Does it hold together geographically? What happens to tax collection, own revenues, operating costs, service spending, reserves? Do citizens accept it culturally?
The data to answer this exists: budget execution per unit, population, boundaries, road networks, surveys and consultations. But it sits in formats no decision-maker can combine, and much of it is recorded at the wrong level: higher-tier services are booked centrally, not against the new footprints anyone actually wants to test. Even a single reform scenario consumes months and dozens of people. And the proposal is hard to evaluate by citizens.
What we built
An interactive scenario builder that puts an entire reform on one map. The core is the same wherever it runs:
- Every unit on one map, with its real finances attached. Population, revenues, operating and service costs, reserves — keyed to official codes and drawn from national official sources. This is the current situation: millions of data points on one screen. An entire country at a glance.
- An edit mode — the heart of the tool. Select units on the map, merge them into a new authority, or dissolve a proposed group. The new unit's financial indicators recompute live as you click, making scenario testing instantaneous and zero-cost.
- Current vs. proposed views to compare today's map against any scenario, with benchmarks (a target population, spend per head) and road or boundary layers for geographic sanity checks.
- Shareable by design: permalinks to any unit, scenario export, search, and a built-in guide to the indicators.
Adapting it to a new country means swapping in that country's administrative units, its official financial data, and its own merger rules, not rebuilding from scratch. The two deployments below show how differently the same engine can be purposed.
Example 1 — the United Kingdom
England is in the middle of the biggest redrawing of its councils in fifty years. Two tiers of local government — county and district — are being abolished across much of the country and replaced by single unitary authorities, each meant to serve around half a million people. Surrey's split is already confirmed in law; Essex, Hampshire, Norfolk and Suffolk have decided footprints; and a swathe of the map, including Sussex, is still unresolved.
The hard part in England's reorganisation is that not only do old districts combine into new unitaries but also councils can disaggregate and inherit a share of the old county's far larger services — social care, schools, county roads — which published accounts record only at county level. So we adapted the engine for England:
- Three views on one map. The councils as they stand today, the footprints the government has already decided, and a build-your-own mode. The status quo, the official plan, and any alternative, side by side.
- Merge districts and watch the numbers move. Click districts to form a unitary and the combined population and spending update live against the 500,000-resident benchmark, so you can tell at a glance whether a grouping clears the bar.
- Five indicators per footprint. Population vs. benchmark, revenue spend per head, council tax requirement per head, reserves as a share of spending, and funding vs. spending.
- Transparent apportionment. County services are shared across the new footprints according to a formula that takes into account district savings, disaggregation costs and one-time reorganisation costs.
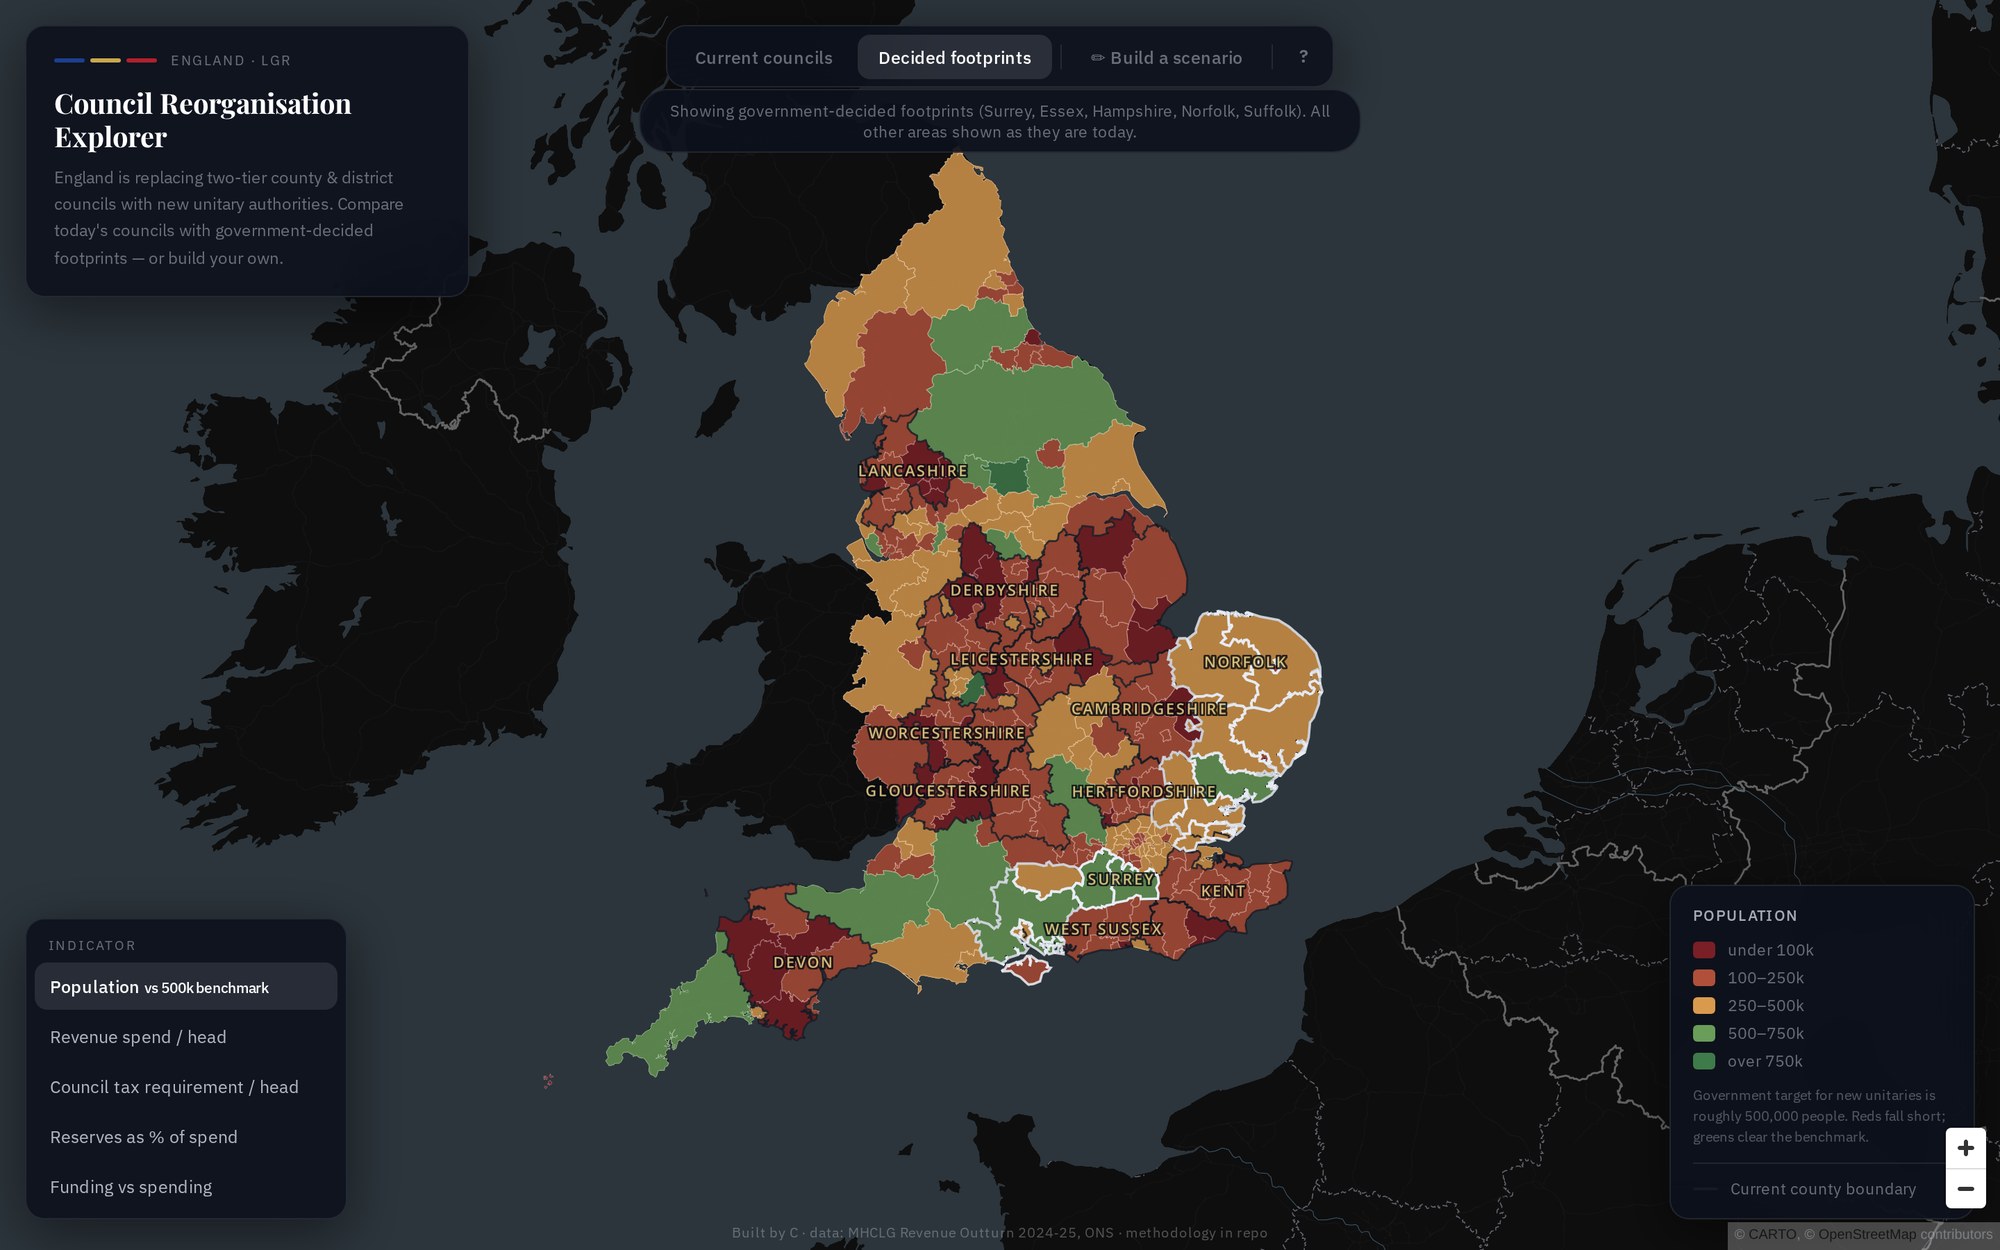
Most reorganisation maps redraw lines; our engine estimates what each grouping would actually save, using a cost-benefit model similar to that of PwC's analysis for the County Councils Network. For every scenario it weighs the gross efficiency gains — economies of scale in back-office functions, procurement, property and senior management — against three offsetting costs: the fixed cost of standing up each new council, the disaggregation penalty of splitting a county's services across several unitaries, and the one-off transition costs. It then reports the net annual saving, the five-year impact, and the payback period for the exact grouping you've drawn.
This live recalculation has been impossible until now. Our engine makes government policy smarter, faster and more intelligible for citizens.
It runs on open official data (MHCLG revenue outturn, ONS population estimates, and ONS boundaries), merging the public tool and the decision-making tool into a single artifact.
Example 2 — Romania
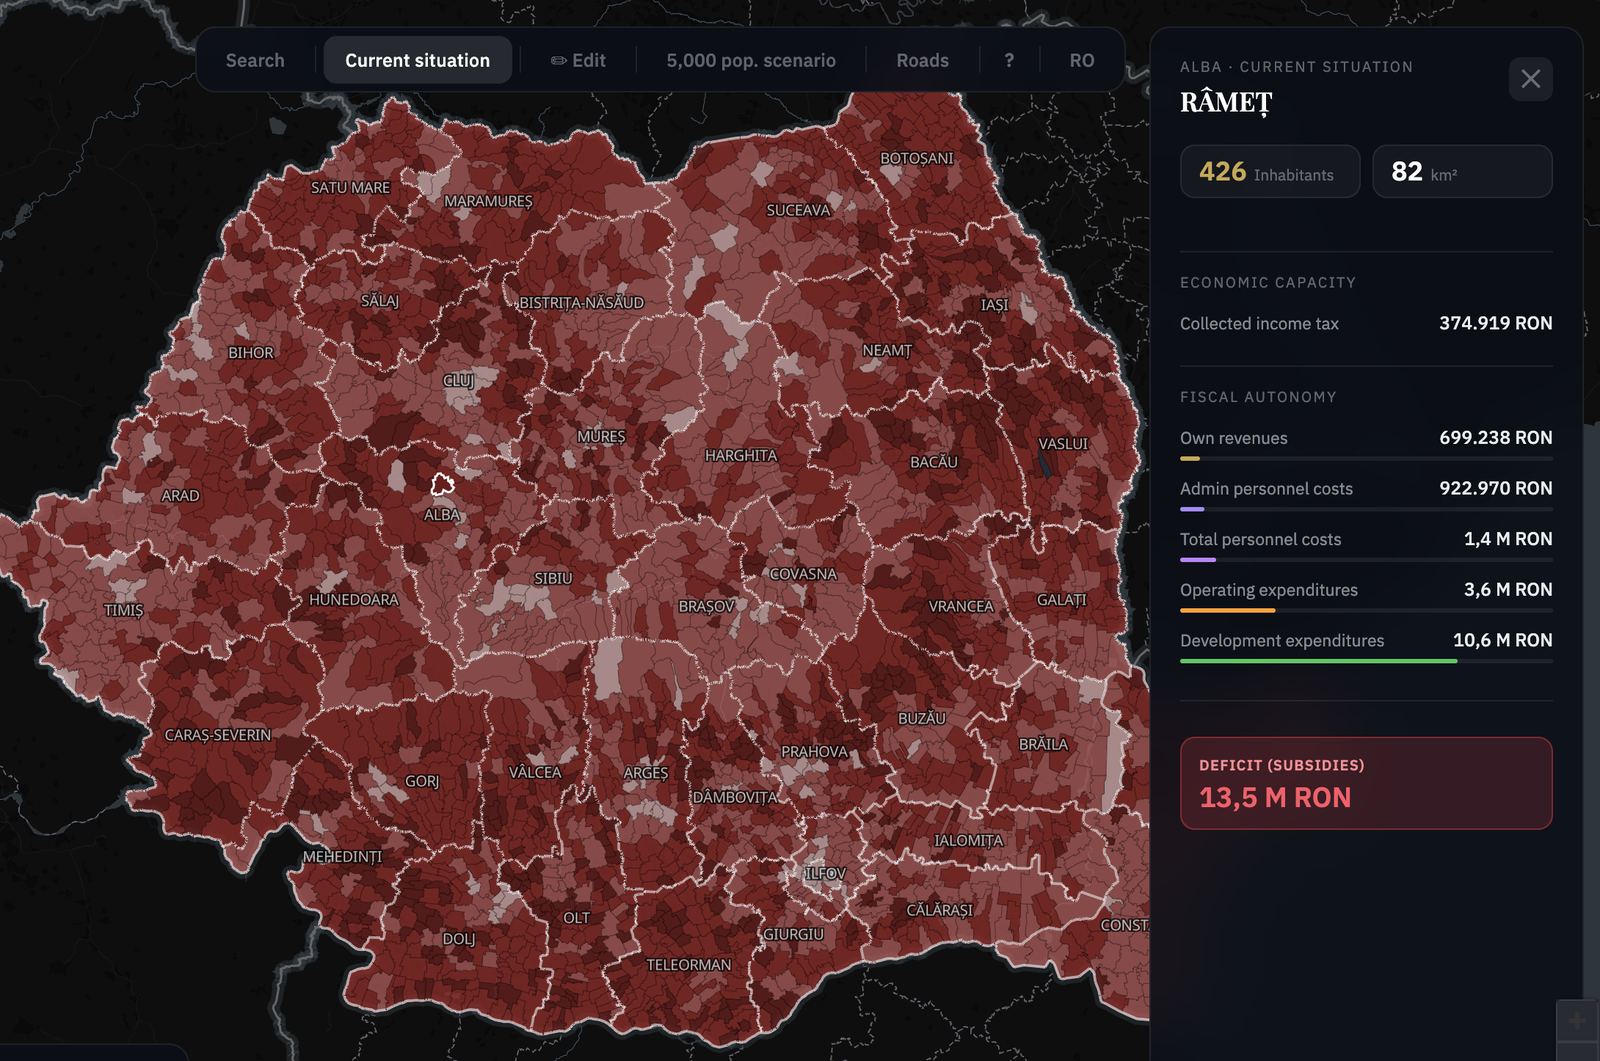
Romania has debated merging its smallest communes for decades. Nearly 2,500 of its 3,186 local administrative units have fewer than 5,000 inhabitants, and many can't fund their own administration from their own revenues. Everyone agrees on the problem. The reform stalls politically but also practically: which communes should merge, and into what.
We turned that hard practical question into a live tool. A regionalization algorithm produces a full national merger scenario for communes under 5,000 inhabitants — a concrete starting point instead of a blank page — and edit mode lets anyone rework it: select communes, merge them into custom groups, and watch collected income tax, own revenues, operating costs and development costs recompute for the new unit. It's fully bilingual (Romanian and English), built on official per-commune budget execution and population data from national sources.
One artifact, two audiences
A decision tool. Officials and analysts stress-test groupings against real finances before anything is proposed publicly. A counter-proposal takes minutes, not a new study of 6 - 12 months.
A public asset. The same tool lets any official, journalist, or citizen look up their own area and see exactly what a merger would mean. Reforms fail when people are asked to trust conclusions they can't inspect; here, the reasoning is the interface.
Planning a territorial reform?